In the July release of vROPs Cloud added support for Synthetic Monitoring
I have seen so many colleagues working on it. This blog is dedicated to all of them. Here it is for the project Hawkeye and to my extended Observability Team.
In this blog, I will share details about Synthetic Monitoring in general and how to configure it in vROps Cloud
What is Synthetic Monitoring
Synthetic Monitoring is a monitoring technique that is done by using a simulation or scripted recordings of transactions. Behavioral scripts (or paths) are created to simulate an action or path that a customer or end-user would take on a site, application, or other software (or even hardware). It provides the following benefits
- Proactive Availability Monitoring
- Reliability
- Measuring SLA
- API Monitoring
What does vROPs Synthetic Monitoring allow?
It allows following
- Monitoring of common user paths in your business applications through simulated API calls.
- Track business application availability and performance.
- Automated anomaly detection of application response time using machine learning.
- Support for OAuth and Bearer Token.
- Correlate business application metrics with infrastructure activities.
How do you configure Synthetic Monitoring?
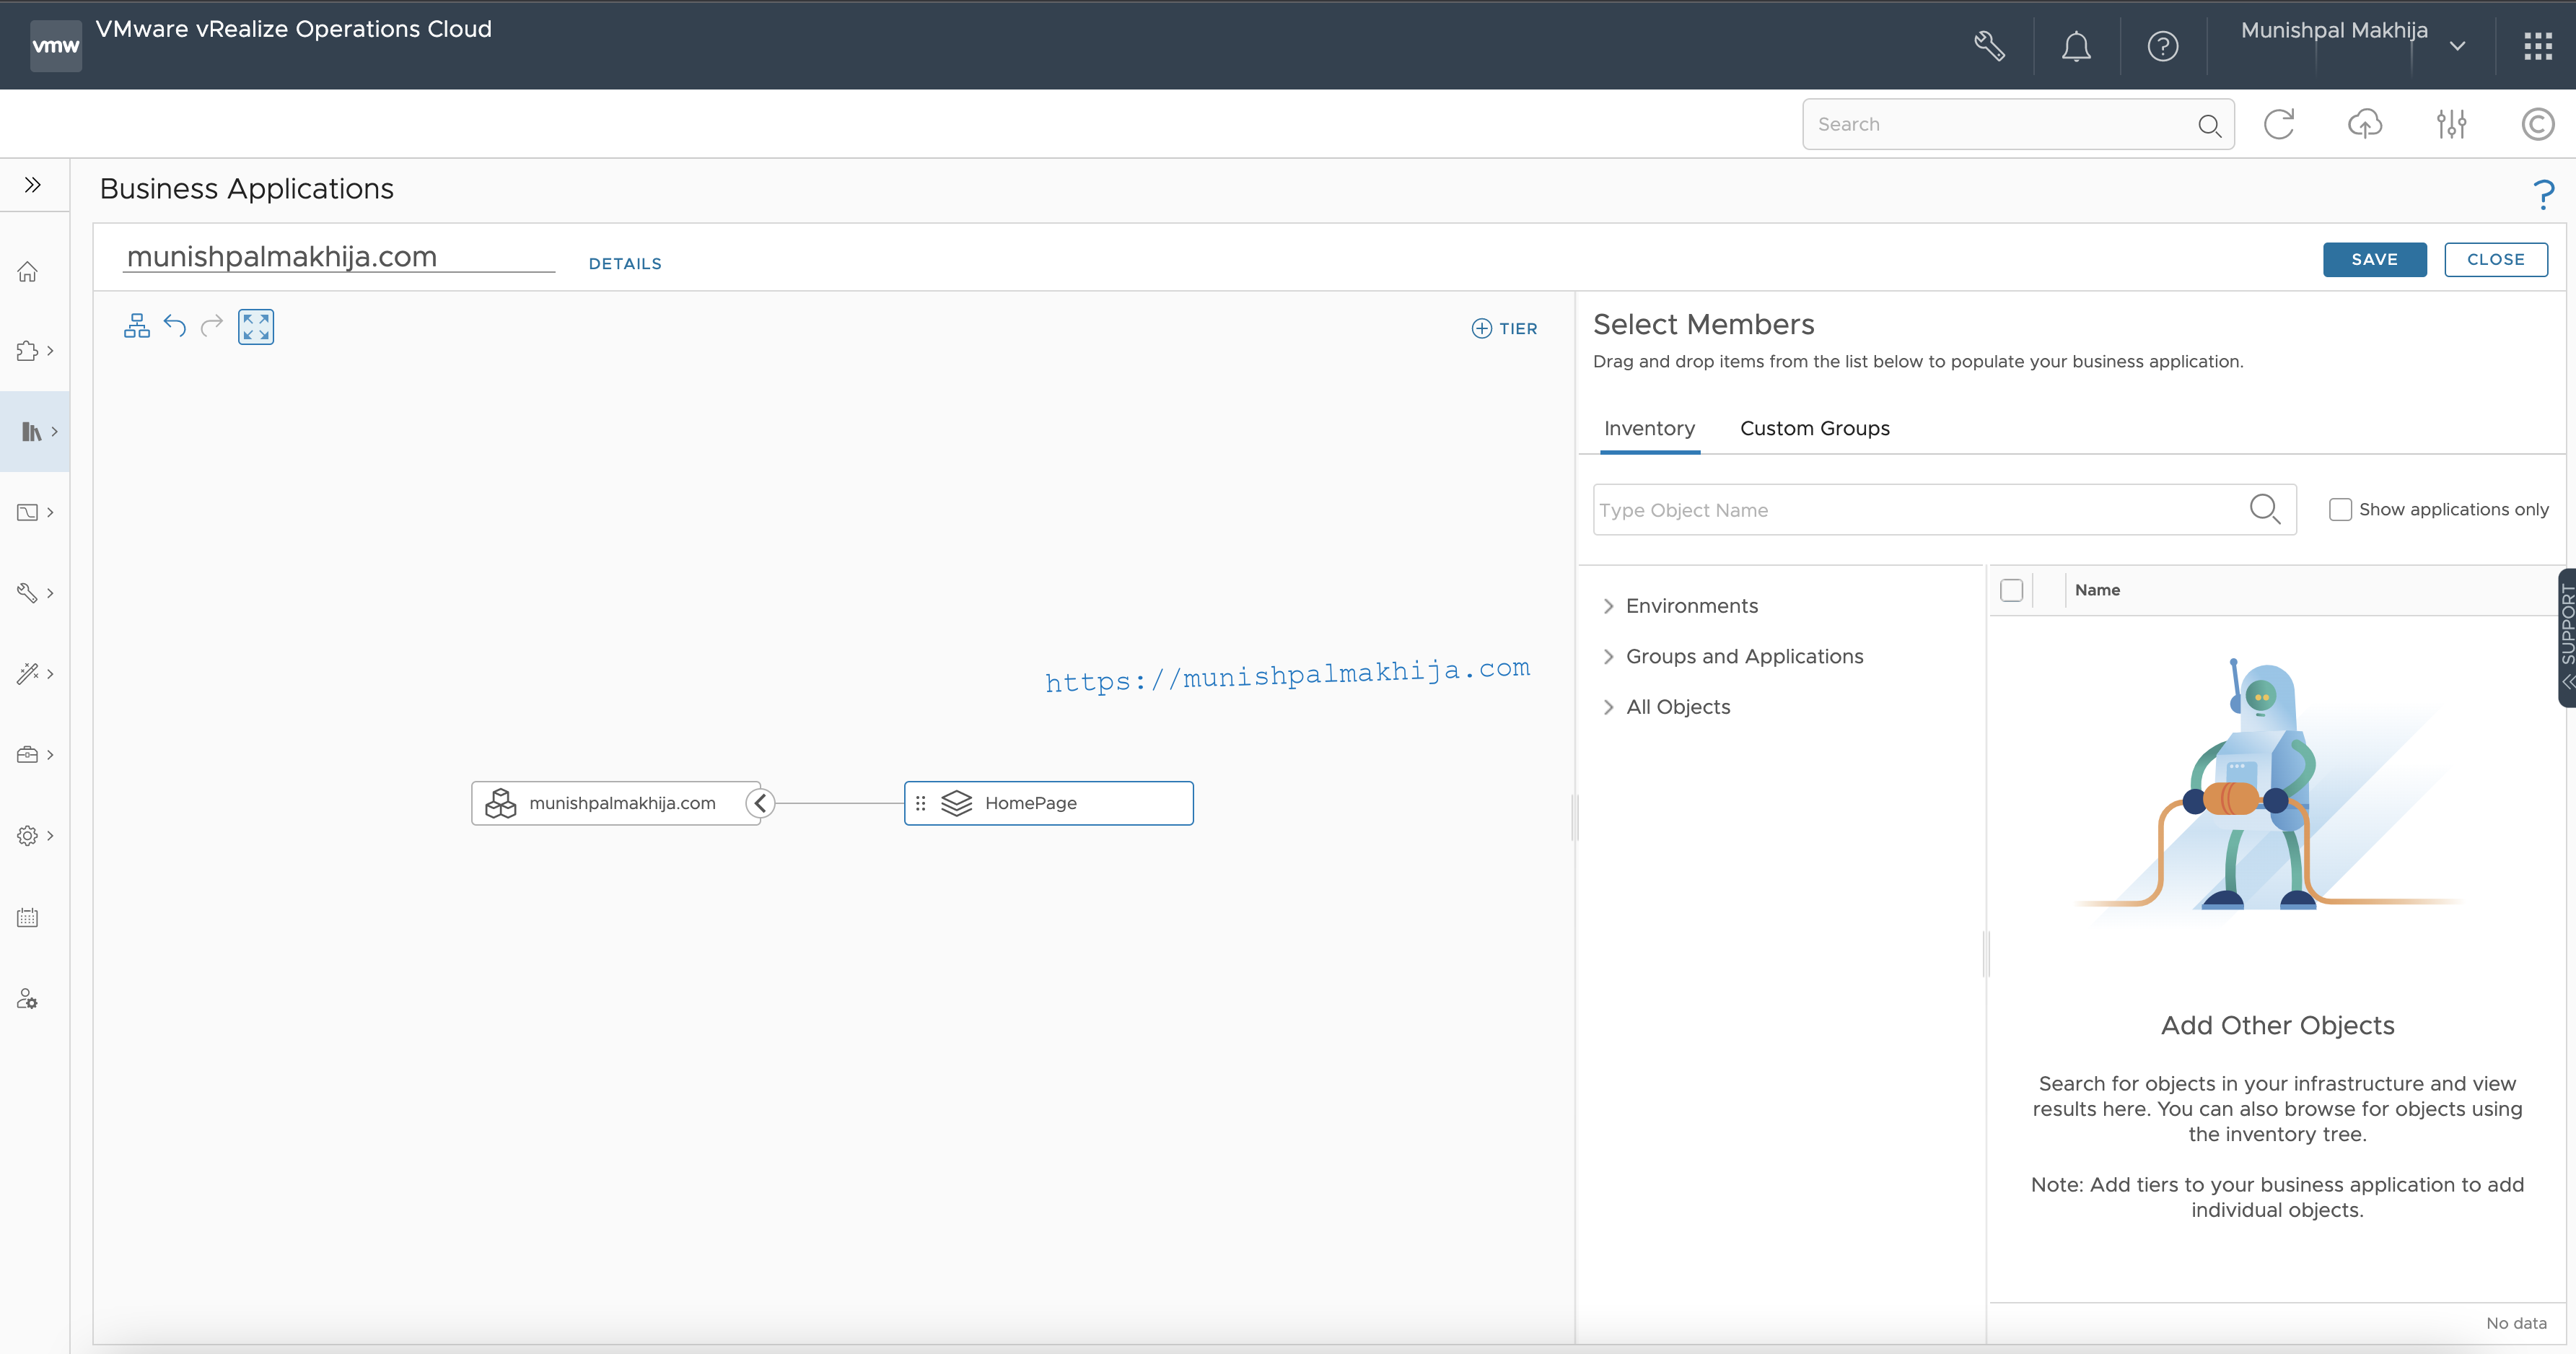
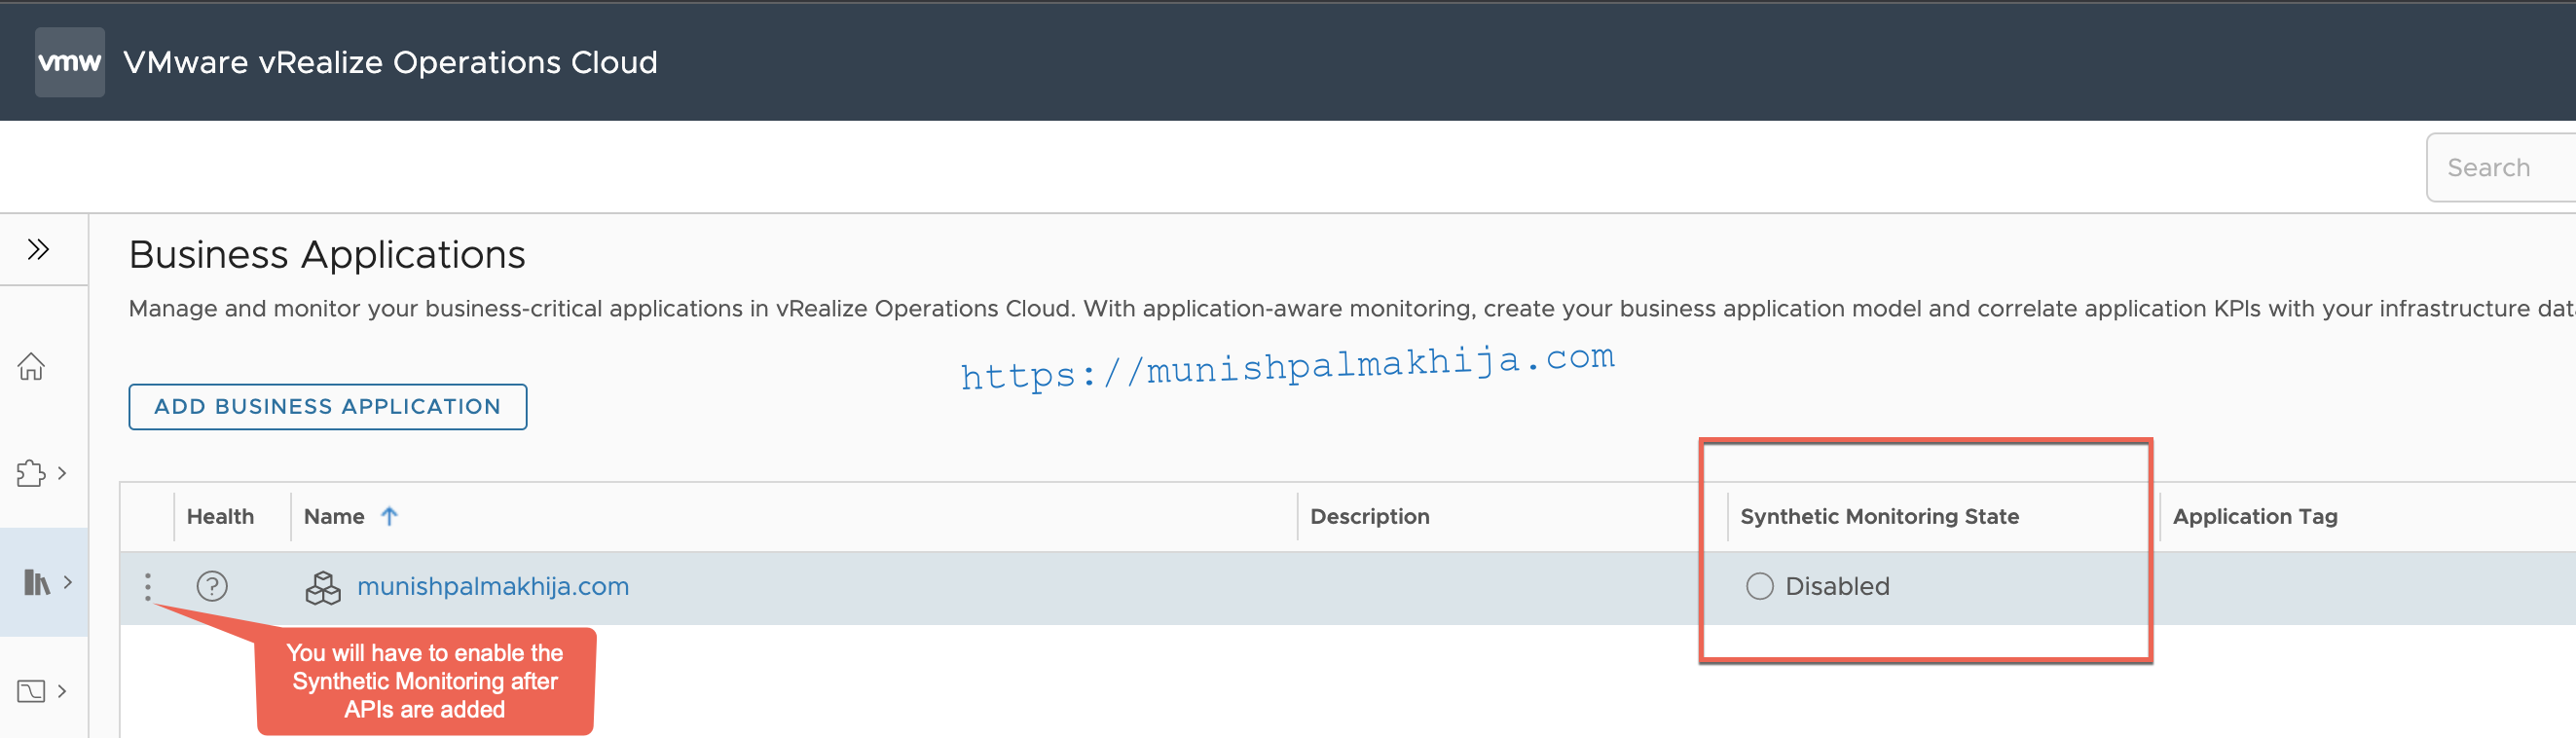
From the left menu, click Environment > Business Application. On the Business Application page, click Add Business Application
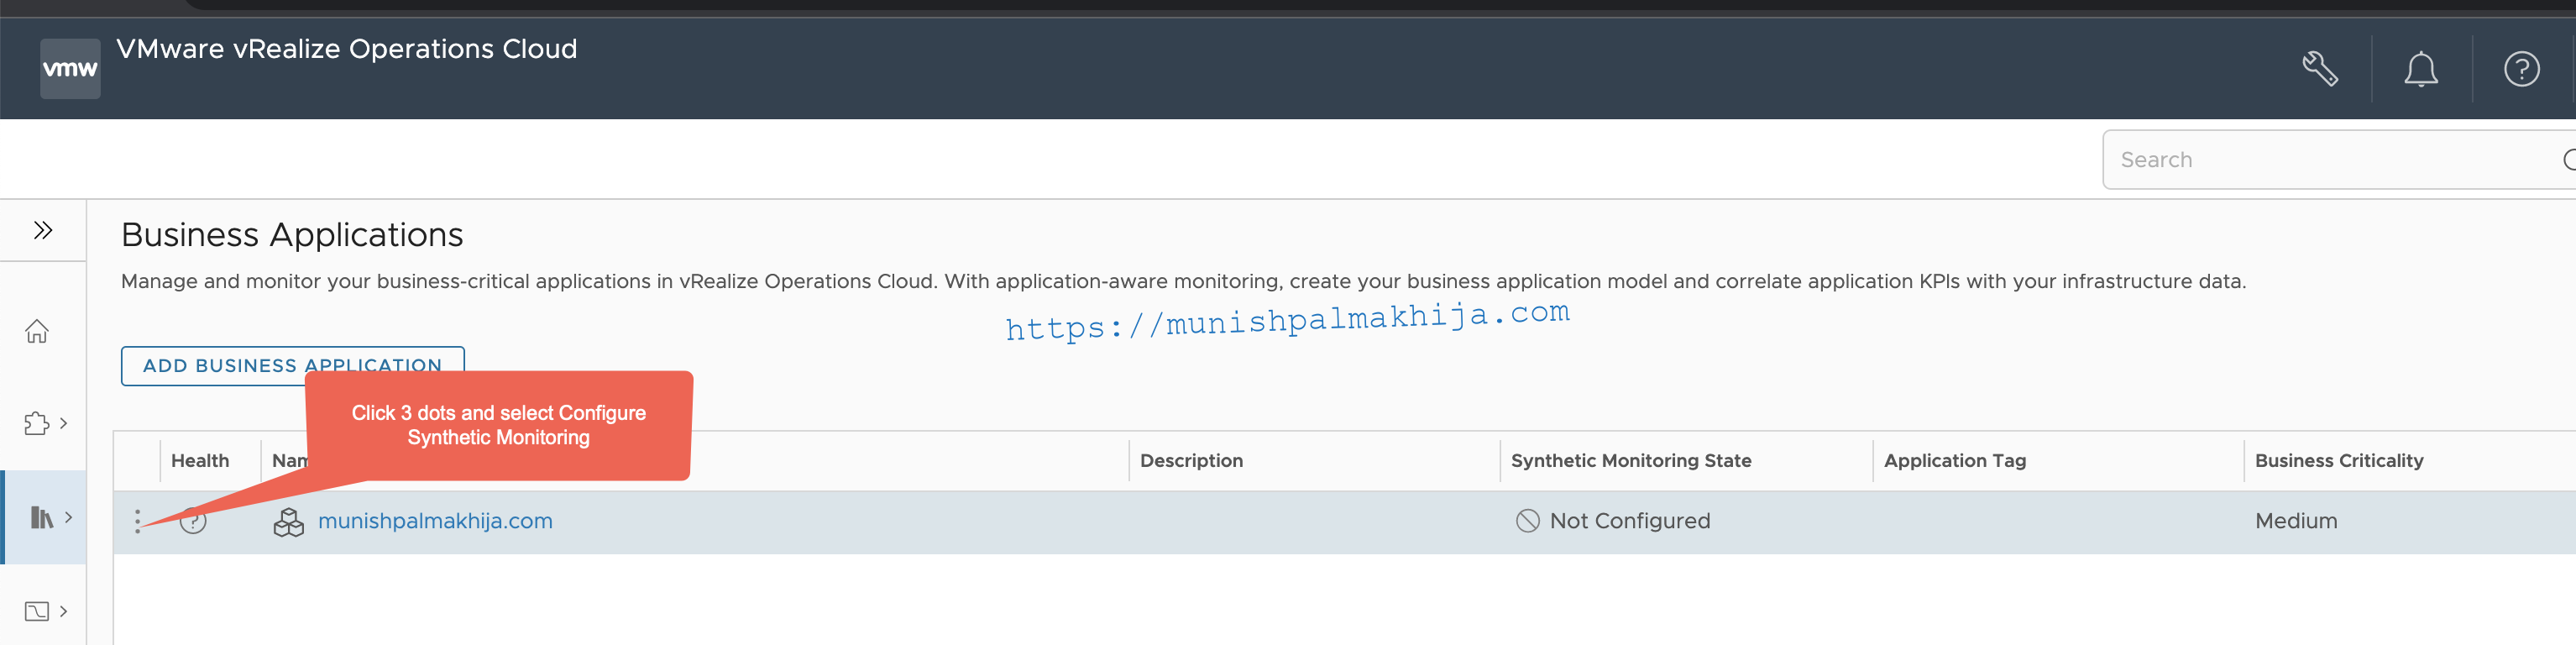
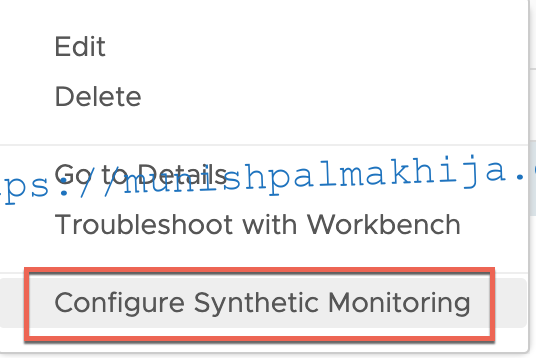
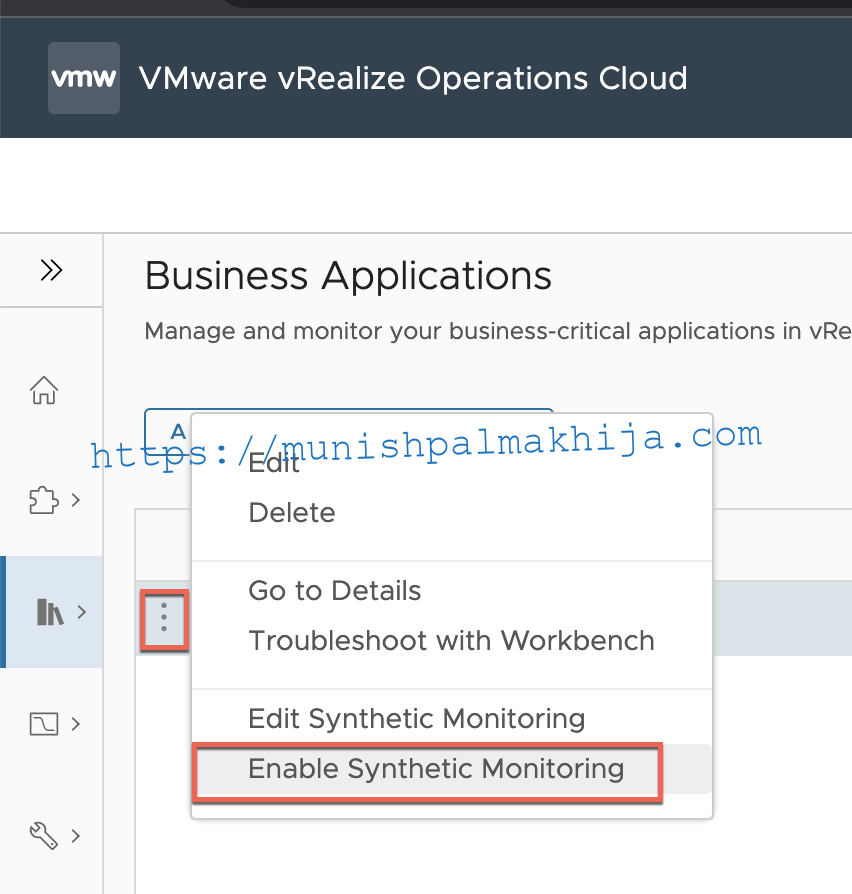
Click the 3 dots next to a Business Application name to configure, enable, or disable Synthetic Monitoring
Click Add API
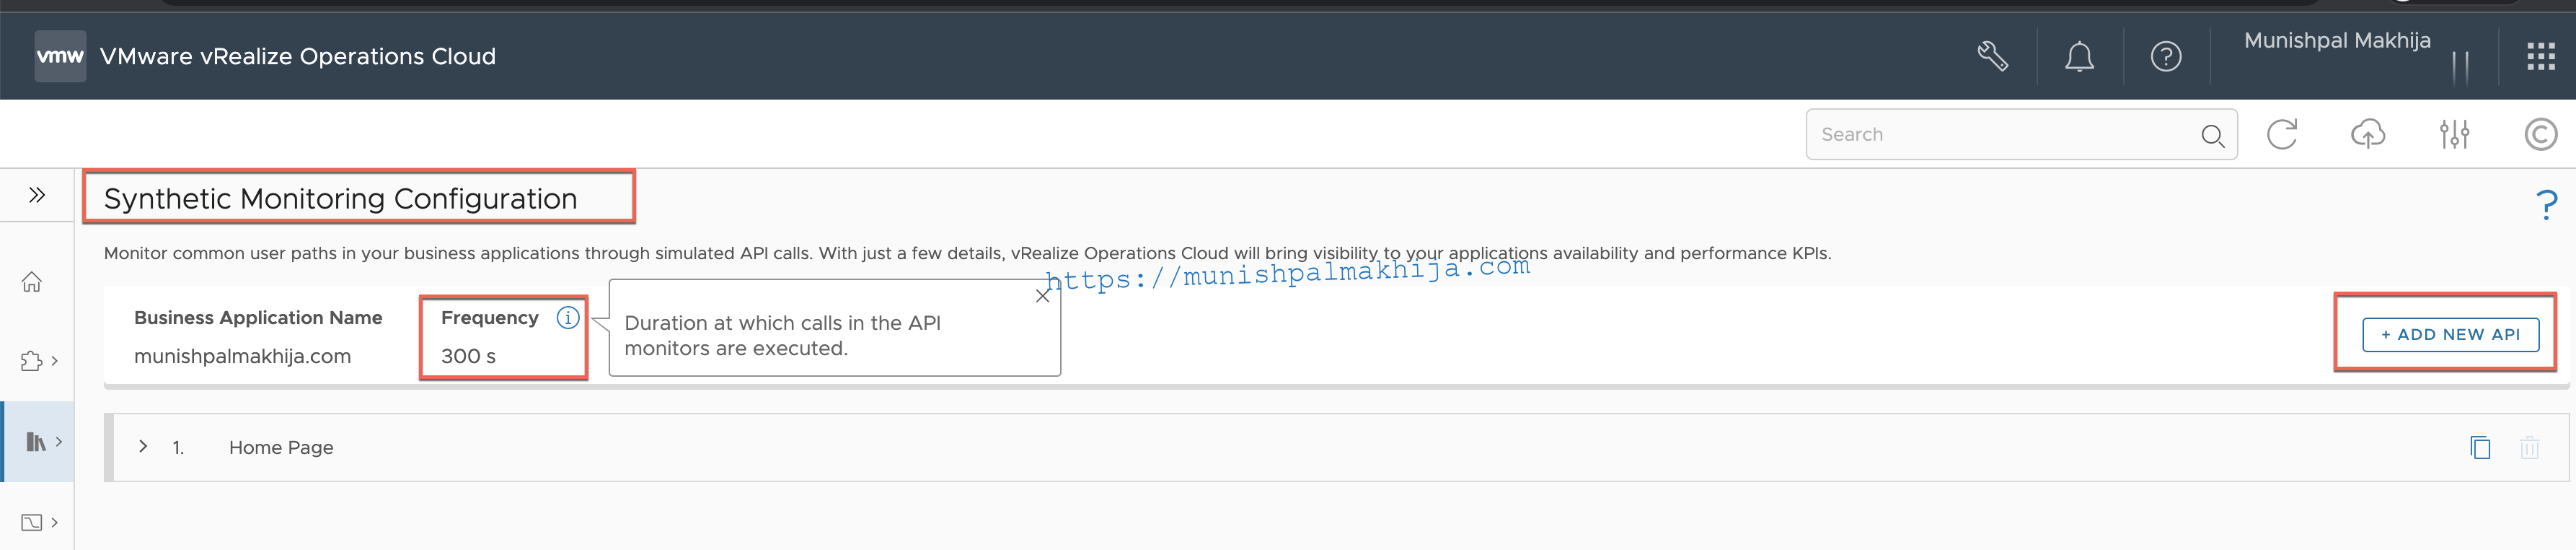
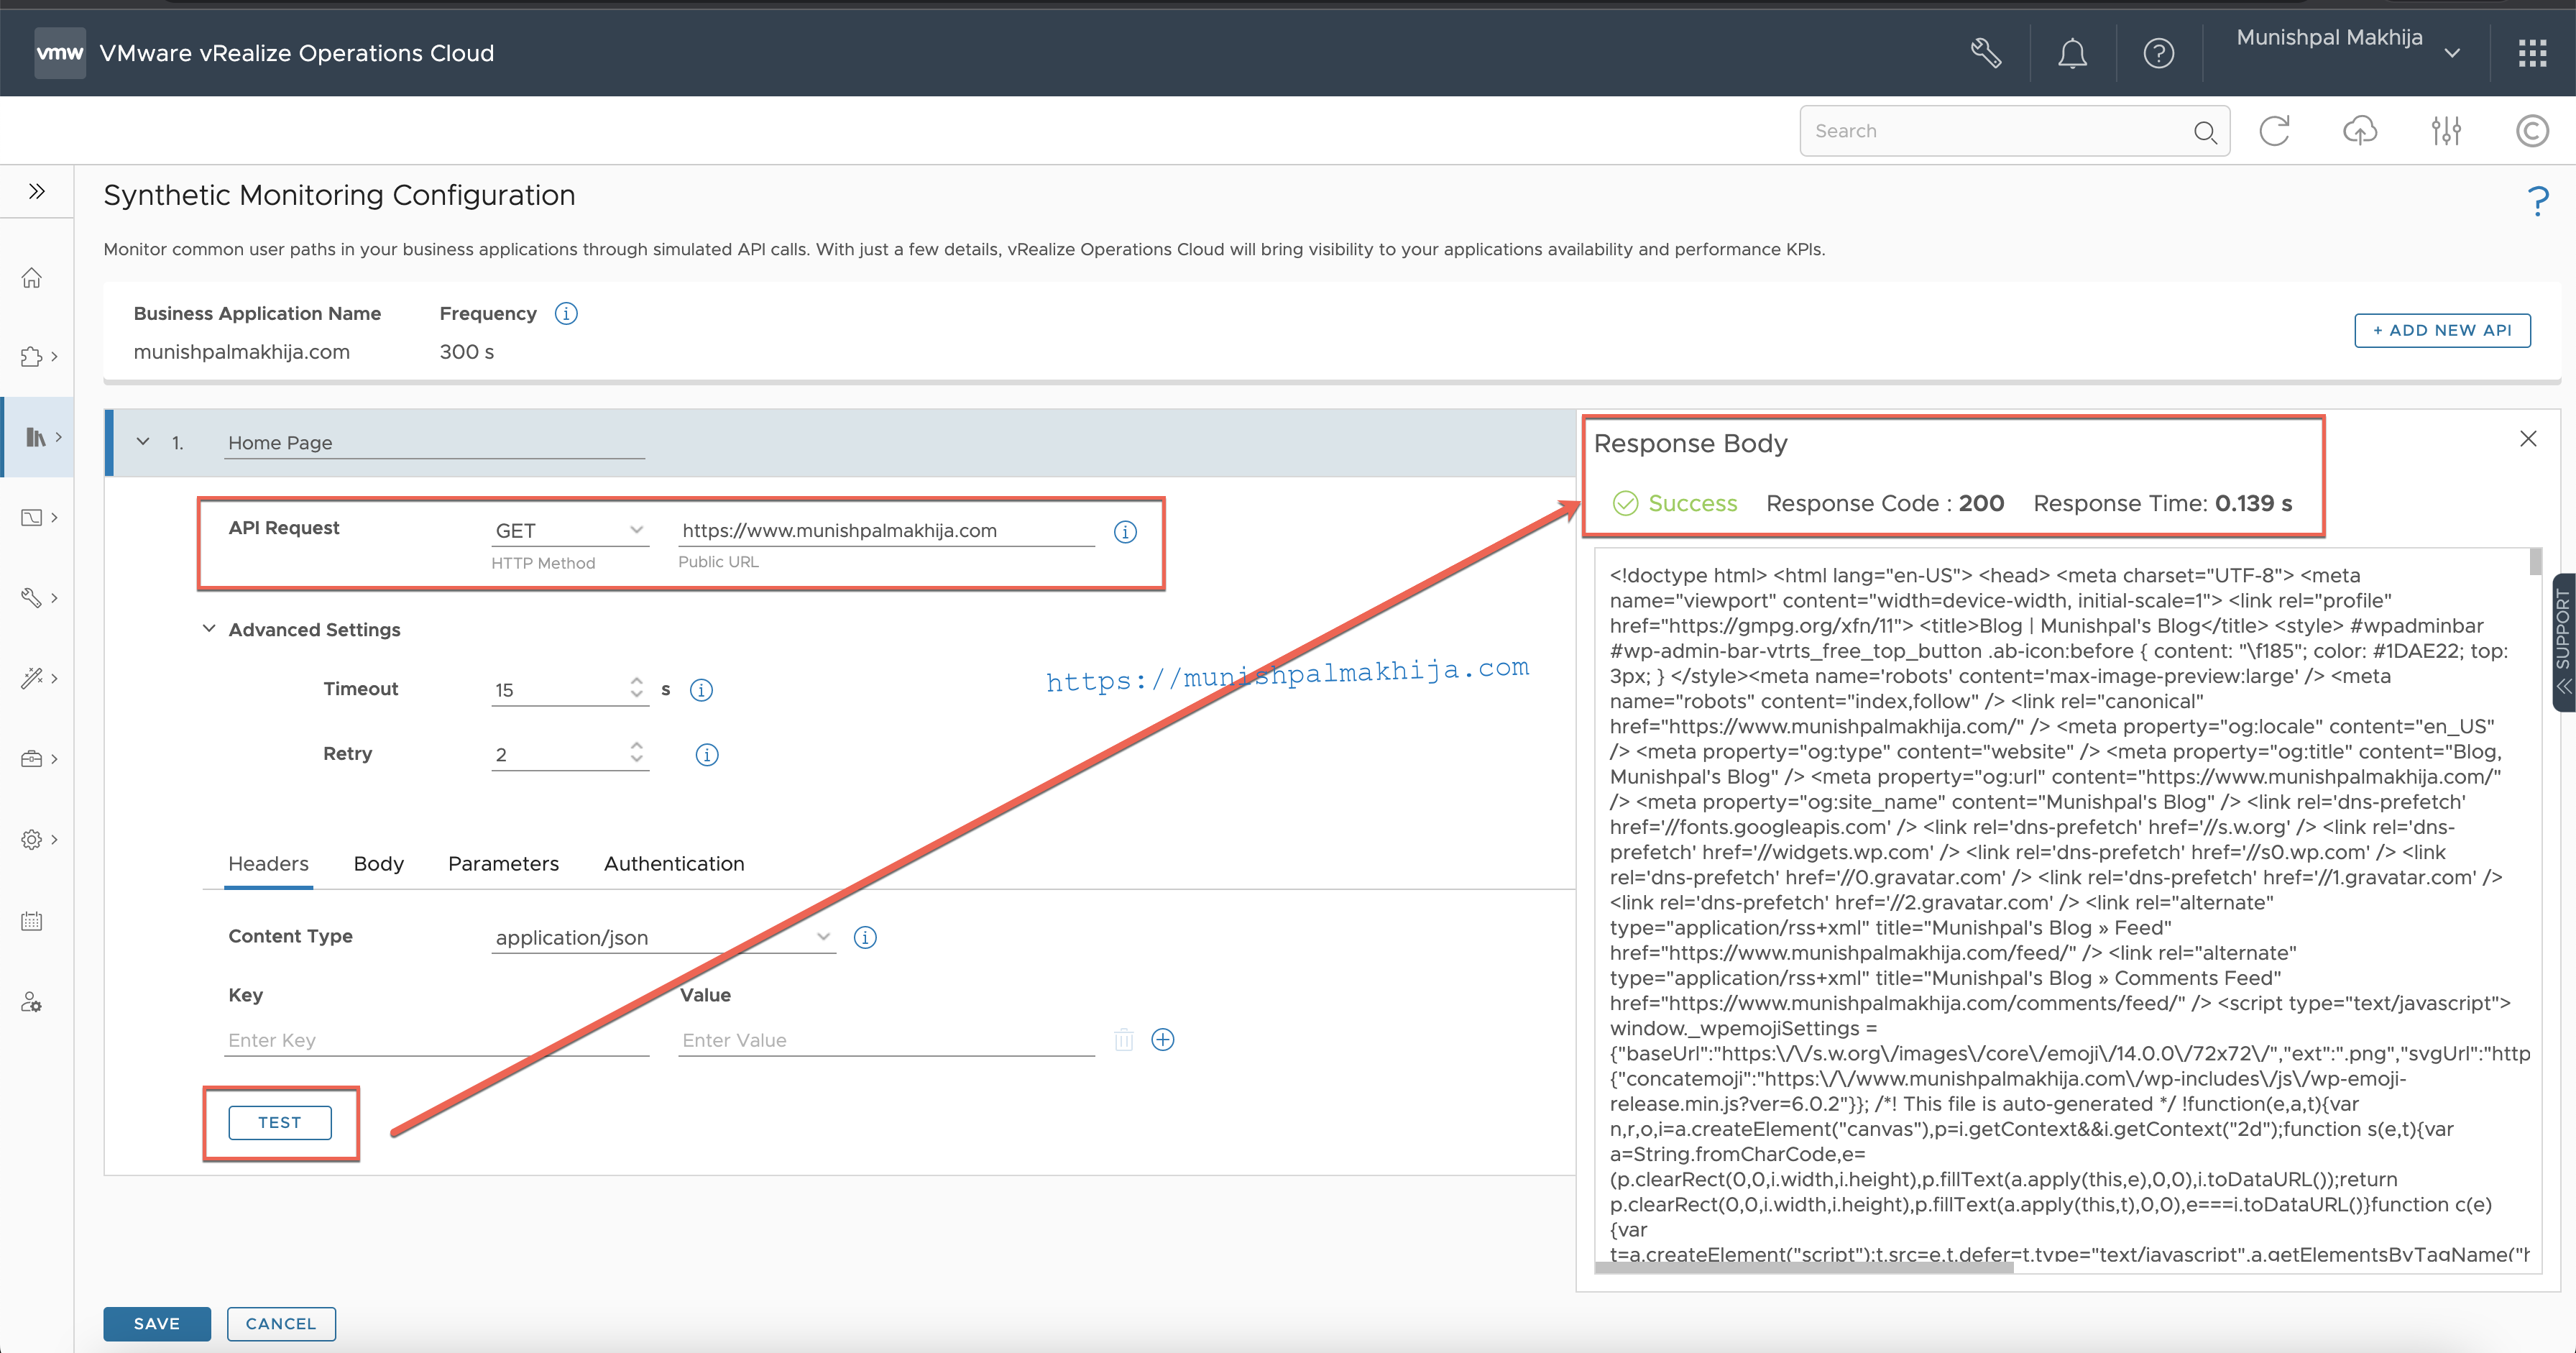
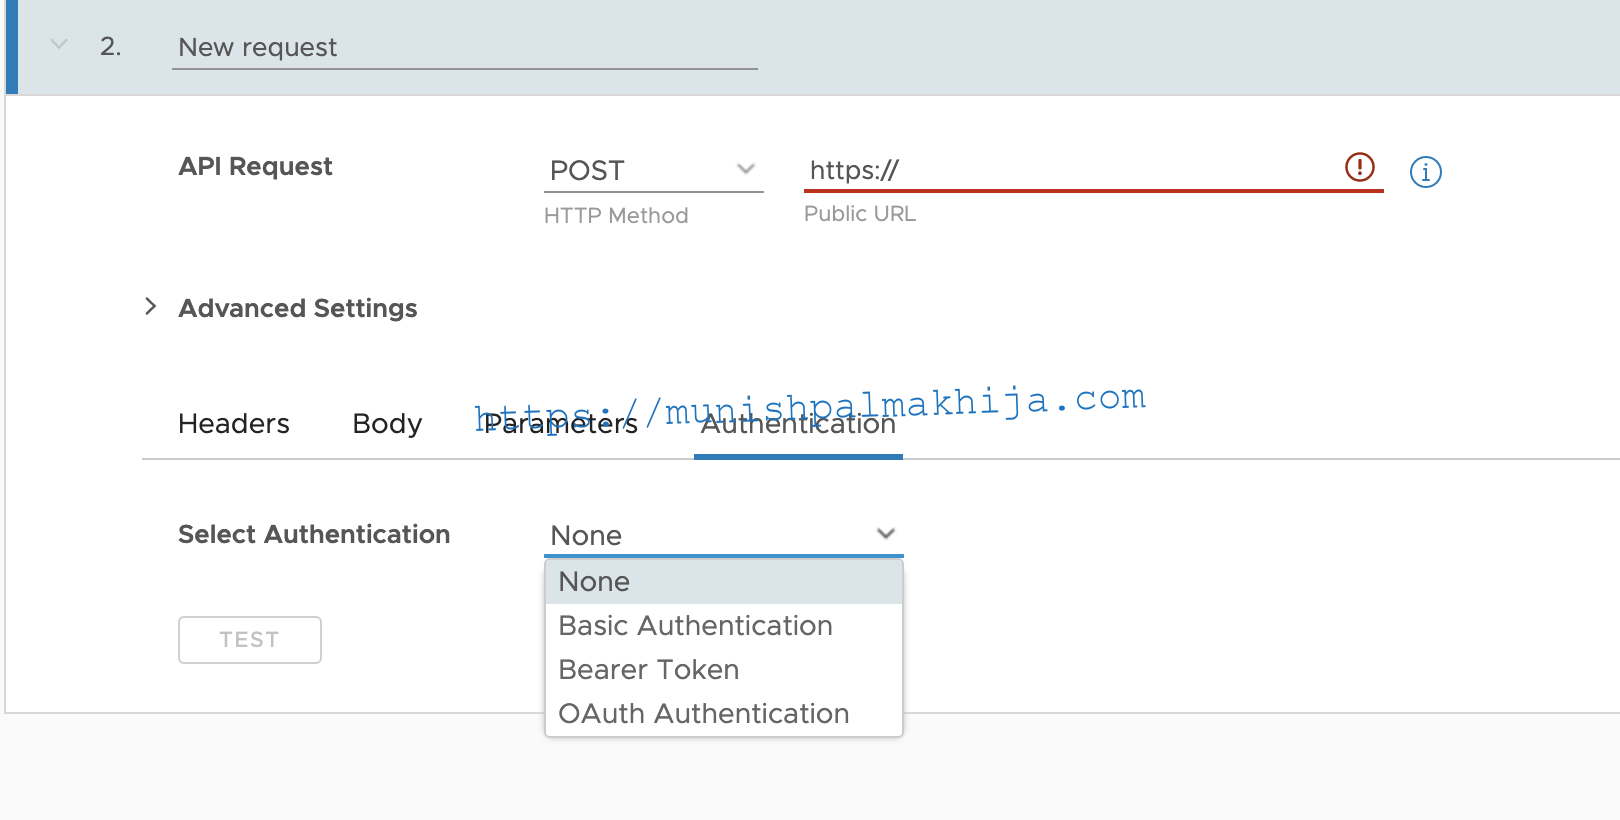
Provide a publicly reachable URL/ API you would like to monitor, for e.g. In my example I am going to monitor my blog’s home page (munishpalmakhija.com)
You can optionally choose to test it before you Save the APIs
Once you save you will need to enable Synthetic Monitoring. By default it is disabled

In my example, I have not used any authentication as I am validating the home page but if you want specific URIs which require authentication then you can select one of the supported authentications
- Basic Authentication
- Bearer Token
- OAuth Authentication
API/URL should be publicly reachable
20 Business Applications with Synthetic Monitoring enabled
10 APIs for monitoring each business application
For more details, you can refer to the documentation
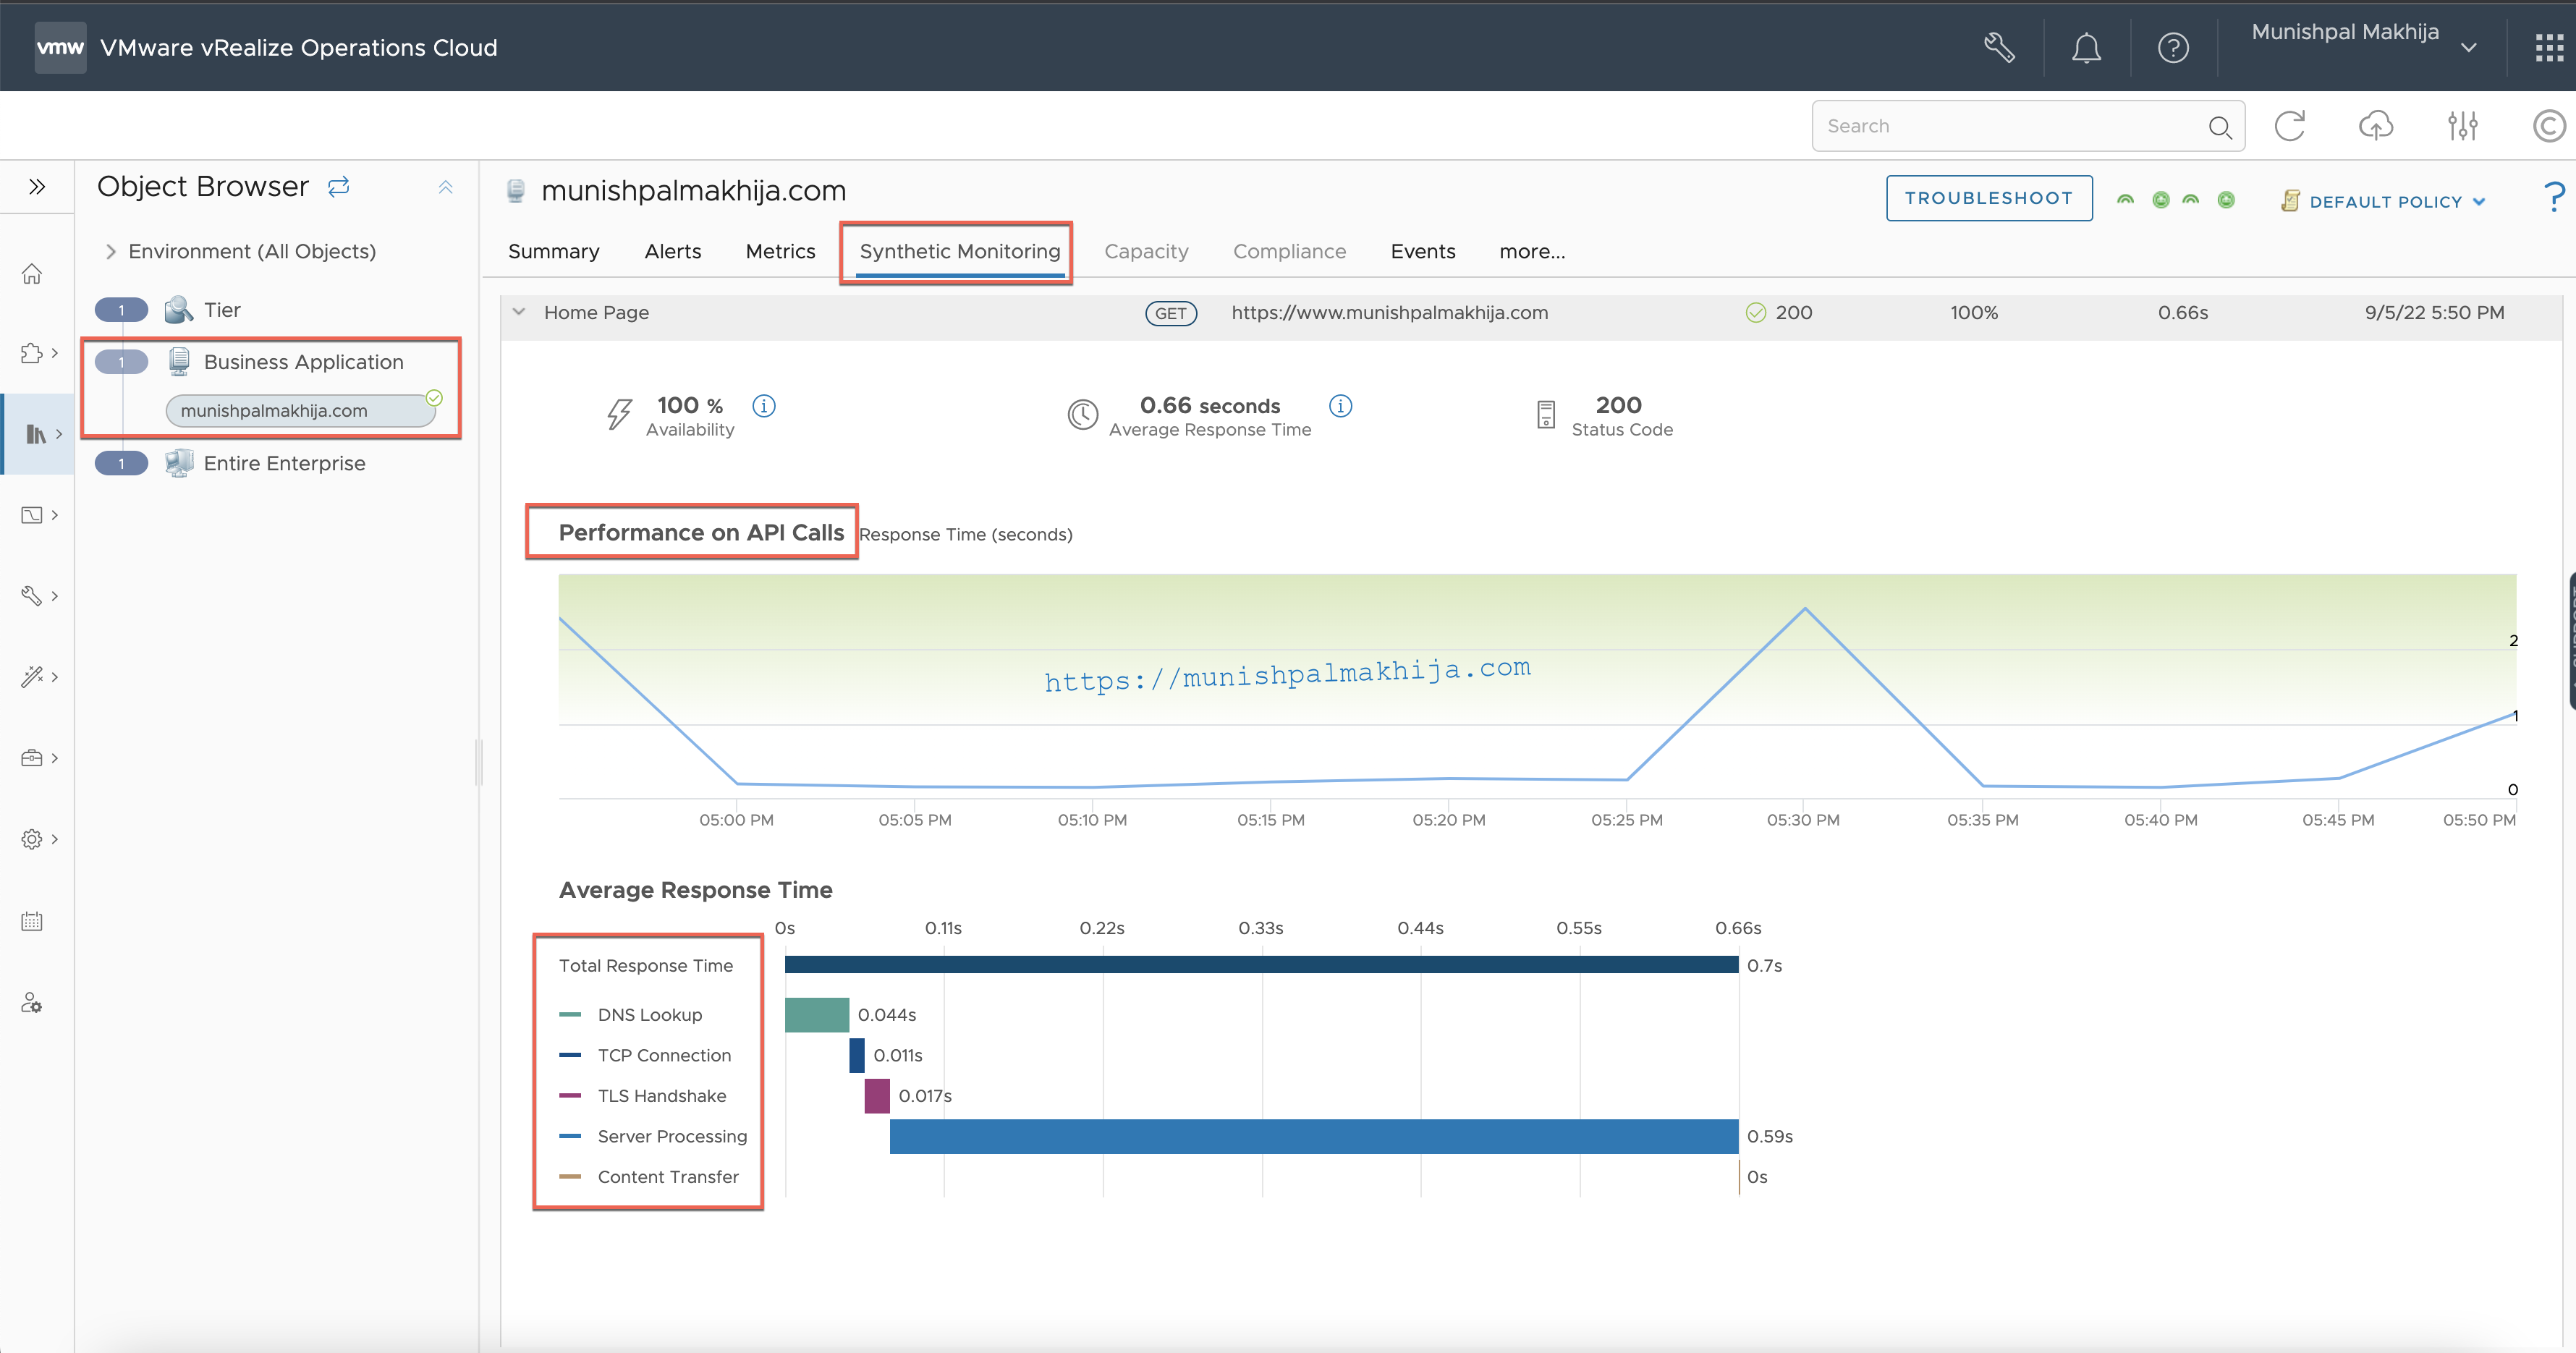
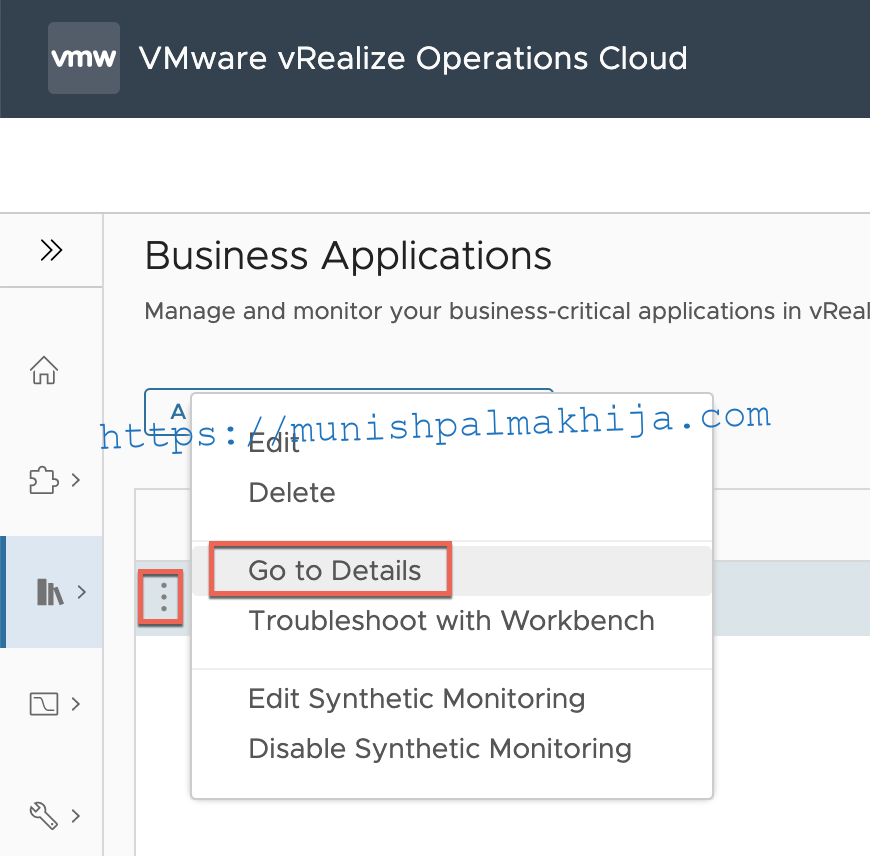
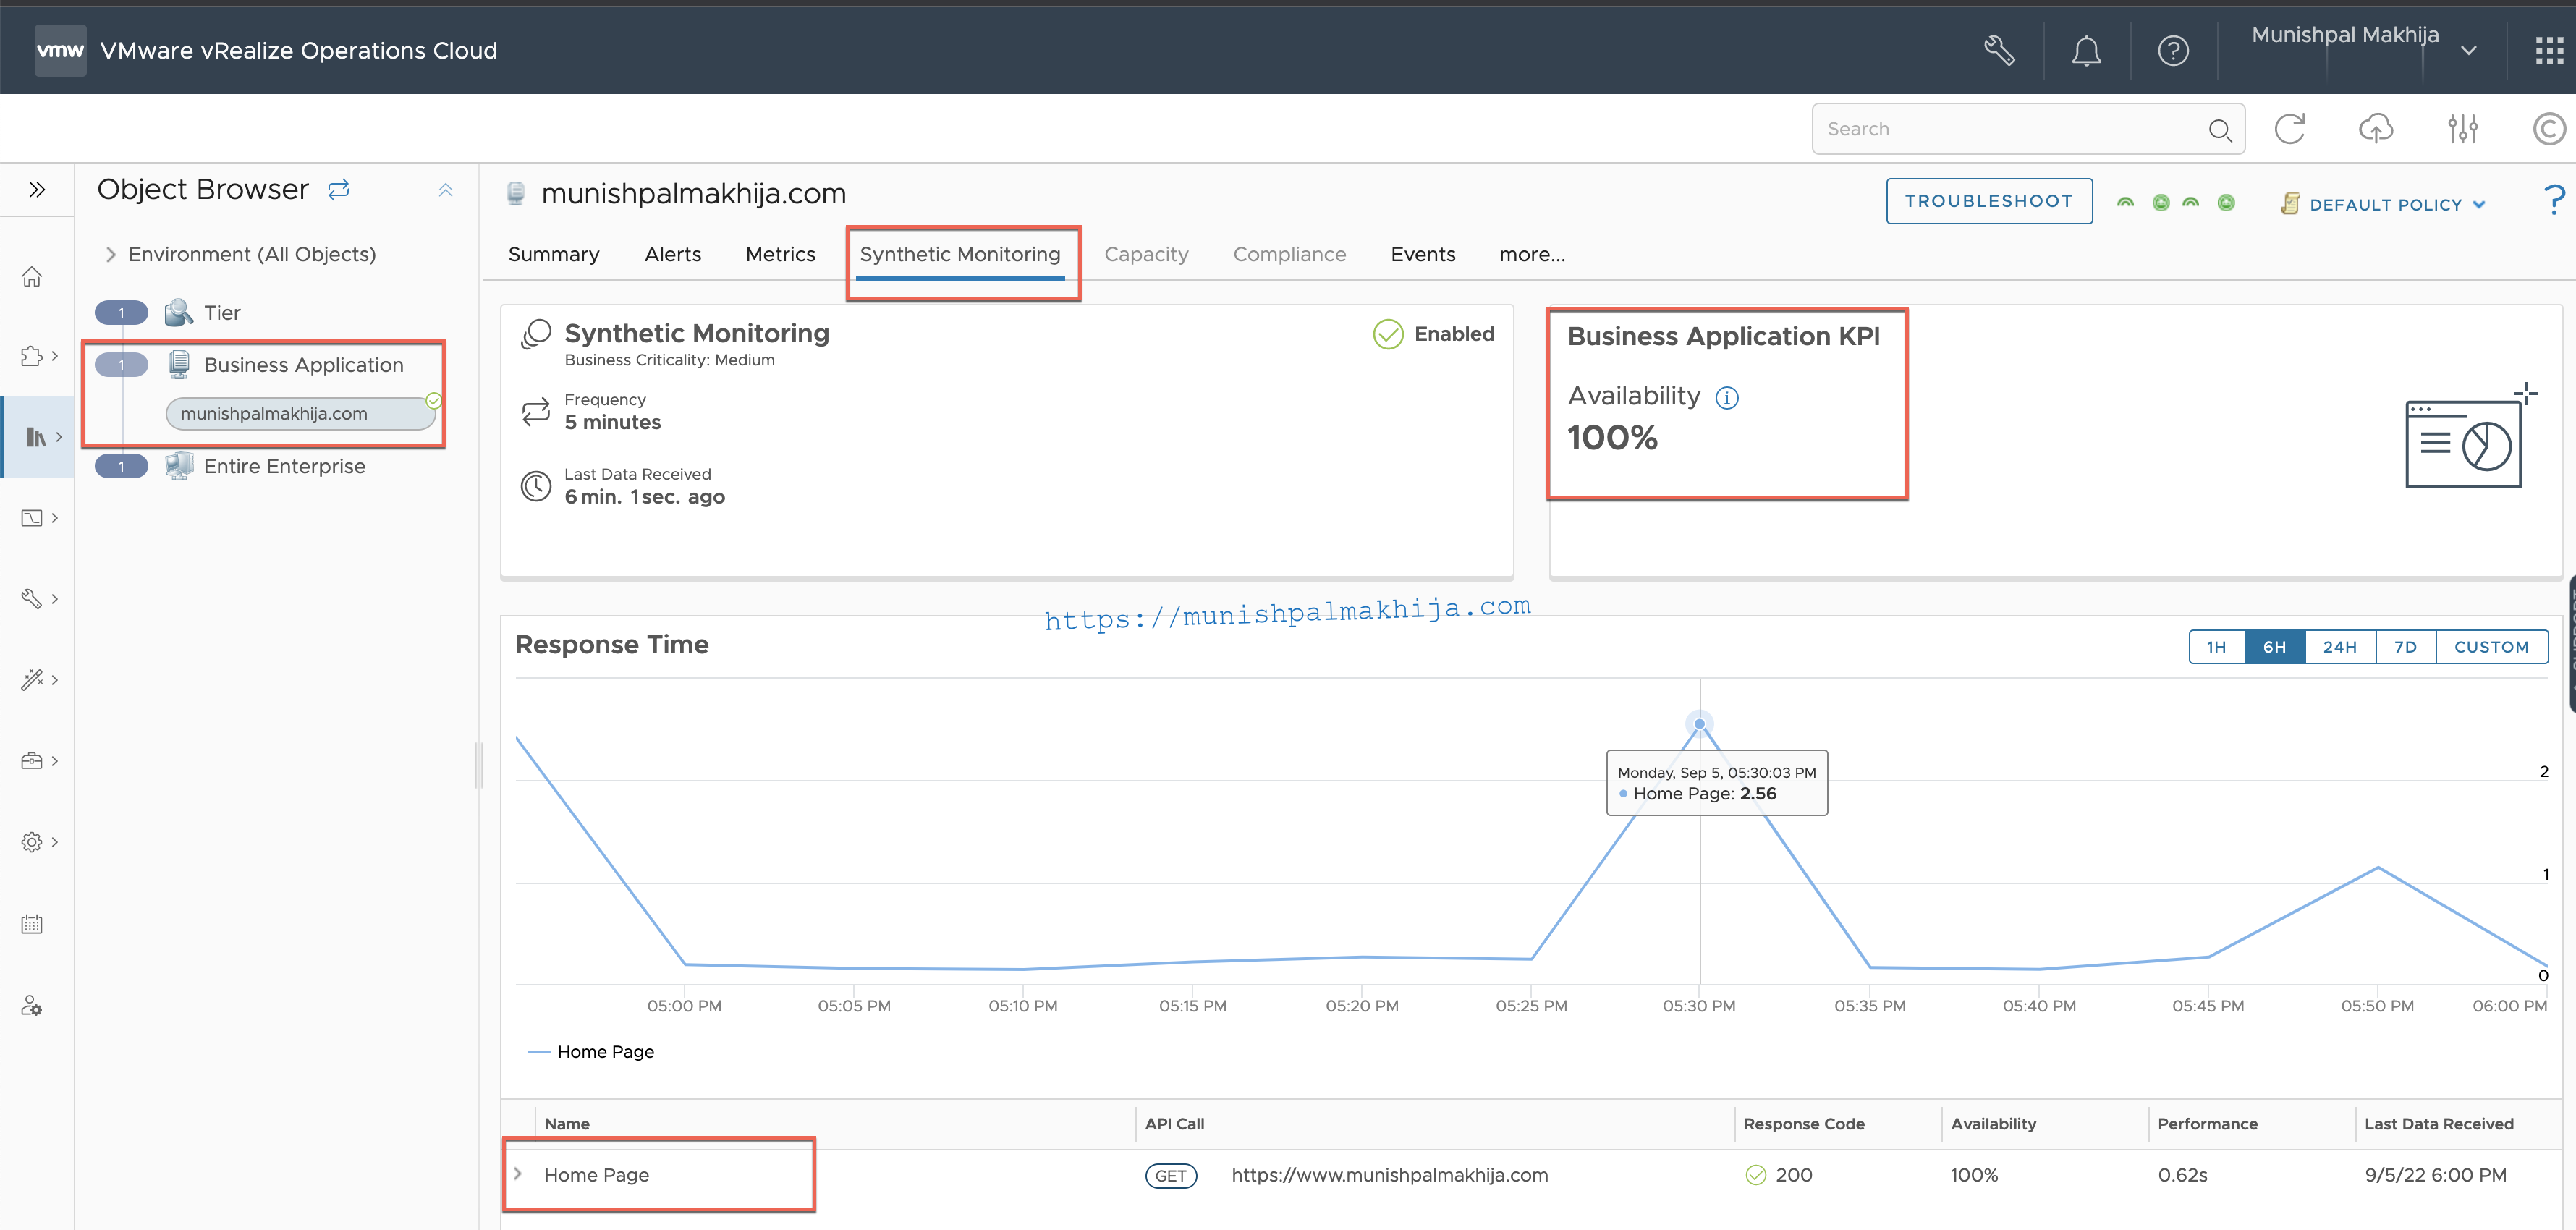
Once the Synthetic Monitoring is enabled then you can navigate to Synthetic Monitoring Tab to view the performance of the application
Click on 3 dots and navigate to “Go to Details”
For each API call, you can view the following details
- Total Response Time
- DNS Lookup
- TCP Connection
- TLS Handshake
- Server Processing
- Content Transfer
You can define alerts using the metrics or properties which are pushed by Synthetic Monitoring 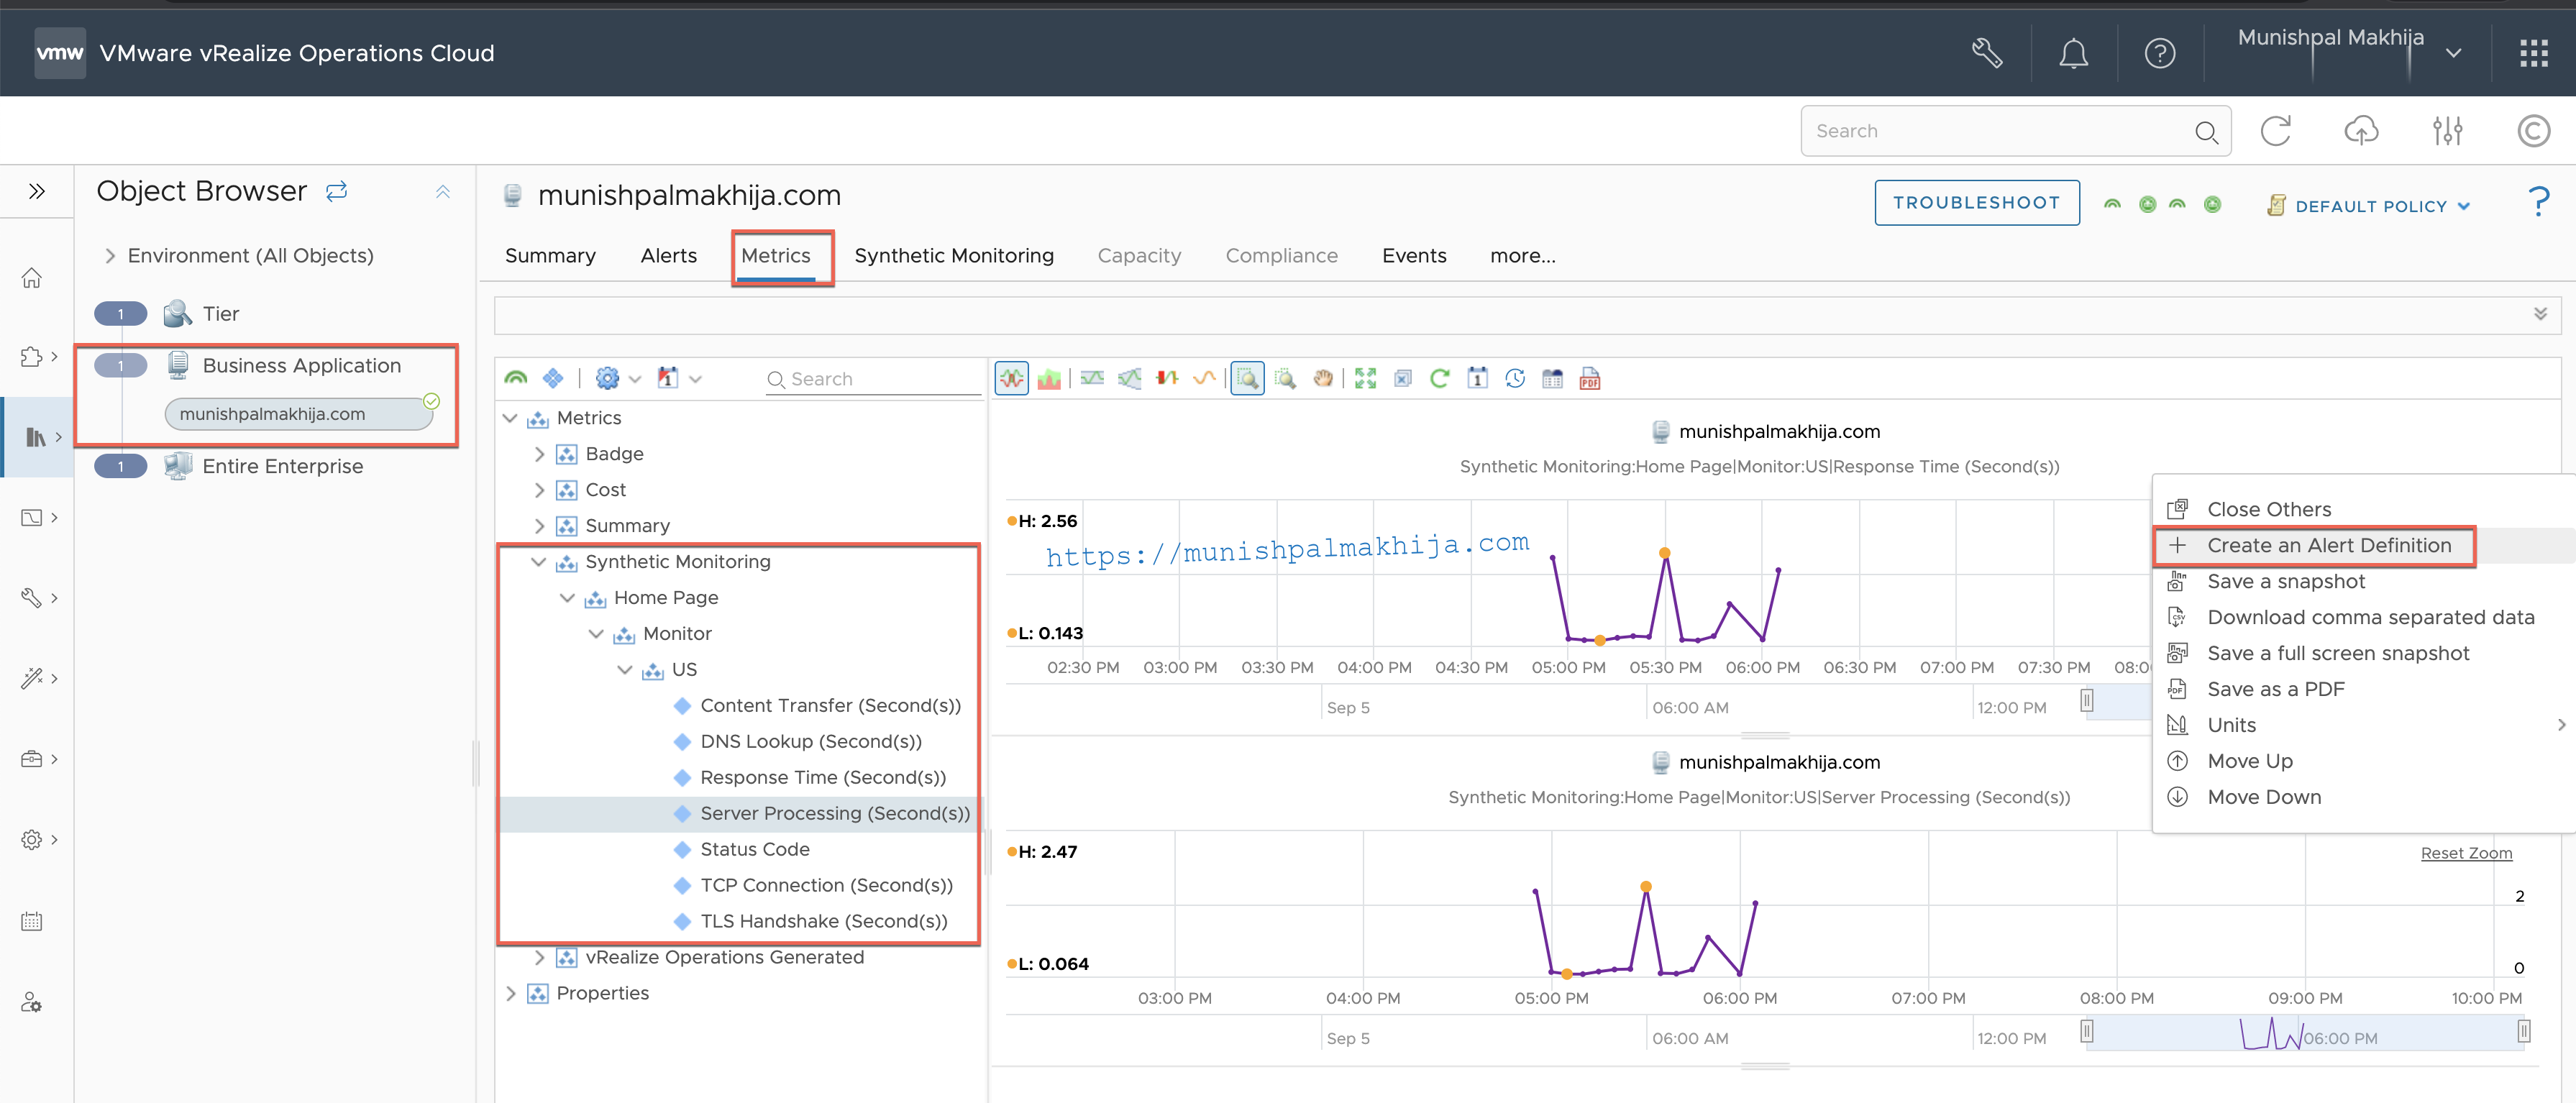
Related Articles
Automate Telegraph Agent Installation using SaltStack for Application Monitoring in vROPs Cloud
Deploy VMware vROPs Cloud Proxy on VMC/ vSphere using Terraform vSphere Provider